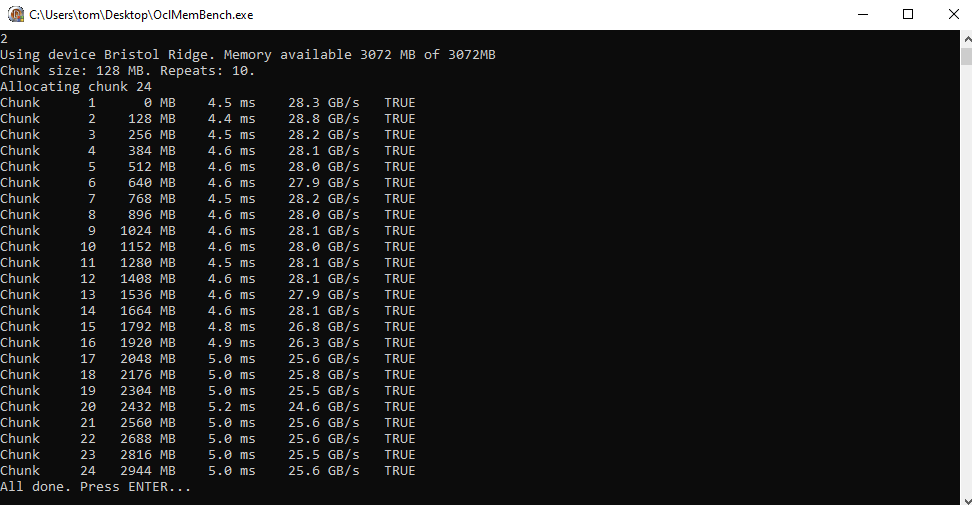
a weird thing going on with RAM performance. i used oclmembench as i have no idea how the aida64 memory benchmarks can be correct showing 15800MB/s read speed on a 38.4GB/s interface
after cold boot it looks mostly fine (although the system RAM portion is already a bit slower than reserved video portion)
here the numbers are just lower but still pretty consitent, sometimes there will be drops to as low as 20.6GB/s
2GB is allocated for integrated GPU, small part of this pool is already used, and in benchmark up to 1792MB is free, then the tool switches to shared RAM and here i have performance drop
just to make it more clear i’m not benchmarking integrated GPU here or use it for gaming, the game runs on discrete, it is just for purpose of testing shared (system) RAM performance
any ideas what can cause this? after cold boot i tried to load first furmark only for 25 minutes and the numbers didn’t go down. then stress the CPU only with cpuburner for 10 minutes, also fine after this
another thing, i tried to reduce memory timings from 17-17-17 to 14-14-14, the tool used shows my modification is correct, fixed the checksum and wrote bin to SPD chip
after booting with modifed timings, hwinfo shows 17-17-17 set is still used even though the memory eeprom dump shows 14-14-14. there is no XMP on memory chips or in BIOS
@karmic_koala, the reduced memory throughput on the second run is probably related to your operating system. Shortly after booting, the OS can allocate memory to your memory benchmark application for writing and reading relatively effortlessly.
On the second run, it became more difficult because your OS has to clean up a bit before it can allocate memory to your application (if you are more interested, you can look for fragmentation and garbage collection). This leads to a slight decrease in the throughput for your application. The effect becomes less noticeable (assuming the same absolute utilisation) with a larger amount of physical memory avaliable.
If the issue is just that the numbers in the benchmark programm are slightly lower on the second run, I would advise you to simply ignore them. Real applications will rather not consider to try occupying all physical available memory.
The various memory timings are relatively easy to understand. The SPD memory only contains information on which timings the SDRAM module supports, while the actual decision on timings is made by the BIOS/UEFI. It also considers which limitations apply to the memory controller of the CPU.
And this is a good thing, because if 14-14-14 would actually be used, you would have successfully bricked your system. The 17-17-17 values were most likely written into the SPD memory by the memory manufacturer and used by the BIOS/UEFI, because the SDRAM simply can’t output the requested data any earlier. These are values that are related to physical limitations and not fantasy values that you can select at will.
well i can run membench for as many times i wish, the numbers are similar, leave the system idle for a while, repeat the bench, the numbers are still good. they go down only after running game for a while. i’d think it shouldn’t affect the performance, especially since game is loaded in VRAM, but then again it also takes about 1GB of DDR4
modules are 2 x 8GB dual rank
since it isn’t possible to OC memory on this system, reducing timing values should improve performance somewhat, why do you think 14-14-14 would brick it? i’ve seen benchmarks where people used 13 on a DDR4-2400 modules, it is not a problem to unbrick even if it wouldn’t work
but as you say, probably some BIOS lock is preventing it.
@karmic_koala, that’s not true, a game also uses the RAM and the CPU. For example, the game mechanics and audio are processed by the CPU. Only textures and things that are required by the GPU for the game’s graphics are stored in the VRAM.
A memory with lower latency would not impact the reduced throughput values because it is an effect that arises at the software level. The connection between CPU and memory maintains a quasi-constant throughput all the time. However, the OS can only allocate a part of the total available memory bandwidth to your benchmark application when it has to clean up data from other applications at the same time.
I would advise you to do some reading on what exactly memory latencies are and try to understand why you can’t just set them to, for example, 1-1-1 (which would actually be perfect values, wouldn’t it?). You can find usual values in the JEDEC standard.
By the way, it also depends on the operating frequency of the memory, 13-13-13 @ 1866 MT/s is quite different from 13-13-13 @ 2400 MT/s. And there are differences in SDRAM chips, which is why the values achieved by others cannot be easily transferred to your modules, unless you know that you are using exactly same modules.
lets assume resource-heavy game is cause of this
i play single map for around 20 minutes, during that time game executable consumes slightly over 1GB of system RAM and 3GB of VRAM
first benchmark run after exiting game should be like that in the case of OS doing clean up, but the follow up benchmark runs should show restored performance if the OS did what it was suppose to do?
it seems to me, the system is trying to adjust memory parameters automatically during gaming to optimize gameplay. it is UE4 game
@karmic_koala, the configuration of the memory does not change after the boot, unless you use specific hardware and manually change something using special overclocking tools then. HWiNFO shows the current values, you can take a look (slight deviations in the clock frequency are normal, but this is caused by inaccuracies in the oscillator and the measurement, it is less than 1% of the value).
You should note that only the last chunks are affected. For the first 15 chunks (equivalent to 1792 MB) there is no noticeable difference and for the remaining chunks the average value is 25.6 GB/s instead of 27.6 GB/s, which means approximately -7% throughput in your benchmark application. I highlighted it in the table using colors.
First run
Second run
Chunk 01
4.5 ms 28.4 GB/s
4.5 ms 28.3 GB/s
Chunk 02
4.4 ms 28.8 GB/s
4.4 ms 28.8 GB/s
Chunk 03
4.6 ms 27.9 GB/s
4.5 ms 28.2 GB/s
Chunk 04
4.5 ms 28.3 GB/s
4.6 ms 28.1 GB/s
Chunk 05
4.5 ms 28.2 GB/s
4.6 ms 28.0 GB/s
Chunk 06
4.5 ms 28.2 GB/s
4.6 ms 27.9 GB/s
Chunk 07
4.6 ms 28.1 GB/s
4.5 ms 28.2 GB/s
Chunk 08
4.6 ms 27.9 GB/s
4.6 ms 28.0 GB/s
Chunk 09
4.5 ms 28.3 GB/s
4.6 ms 28.1 GB/s
Chunk 10
4.5 ms 28.2 GB/s
4.6 ms 28.0 GB/s
Chunk 11
4.6 ms 28.1 GB/s
4.5 ms 28.1 GB/s
Chunk 12
4.6 ms 27.9 GB/s
4.6 ms 28.1 GB/s
Chunk 13
4.5 ms 28.2 GB/s
4.6 ms 27.9 GB/s
Chunk 14
4.6 ms 28.0 GB/s
4.6 ms 28.1 GB/s
Chunk 15
4.8 ms 26.8 GB/s
4.8 ms 26.8 GB/s
Chunk 16
4.6 ms 27.7 GB/s
4.9 ms 26.3 GB/s
Chunk 17
4.6 ms 27.6 GB/s
5.0 ms 25.6 GB/s
Chunk 18
4.7 ms 27.4 GB/s
5.0 ms 25.8 GB/s
Chunk 19
4.7 ms 27.4 GB/s
5.0 ms 25.5 GB/s
Chunk 20
4.6 ms 27.8 GB/s
5.2 ms 24.6 GB/s
Chunk 21
4.6 ms 27.7 GB/s
5.0 ms 25.6 GB/s
Chunk 22
4.7 ms 27.5 GB/s
5.0 ms 25.6 GB/s
Chunk 23
4.6 ms 27.6 GB/s
5.0 ms 25.5 GB/s
Chunk 24
4.6 ms 27.8 GB/s
5.0 ms 25.6 GB/s
When your game does not run smoothly, you can try to reduce the settings in your game. If you are interested in how the OS handles memory and why this effect might occur, you can read about the topics mentioned. However, from a practical point of view it is of little relevance because the effect only occurred in a benchmark and only with the last chunks (in other words with a relatively high memory utilization).
by “specific hardware” you mean what? this chipset has IOMMU, not seeing any difference with it enabled in BIOS. no memory OC tools are used
the effect occurs in game as well, as i said several first minutes it is running properly and then starts occassional stuttering
if the benchmark app supported 80 chunks, probably all of them after chunk 15 would show performance drop. video reserved memory space probably has MTRR set by BIOS so that windows can’t interfere with it, or win simply don’t use it and the performance thus does not change within first 15 chunks
since the UT4 game was never official, i tried to load UT3 (not sure but i’d guess UE3 engine) and the same thing did happen
@karmic_koala, for instance “Asus MemTweakIt”, which allows limited manual changes during runtime (you can read more about it here).
But I don’t think that’s particularly relevant, the point is you argued that your system changes the memory configuration automatically while it’s running (“it seems to me, the system is trying to adjust memory parameters automatically during gaming to optimize gameplay”). I replied this to explain that your thesis makes no sense.
if the benchmark app supported 80 chunks, probably all of them after chunk 15 would show performance drop.
It would be a good idea to use a more common / well working benchmark application (for instance PassMark Memory or Aida64). This should work for the entire memory and provide a significantly more meaningful result. In addition, you could use HWiNFO to monitor other values (before, during and after running your game) to investigate other possible reasons such as throttling.
really? same game with different pair of DDR4 modules, same result only numbers were even worse.
i installed a game from 2005 which shouldn’tt be heavy on resources, played with highest settings including max antialiasing. after exiting the game benchmark numbers remained the same as before starting the game. so it has something to do with UE4, the engine need more resources or the game as unifinished has bugs that cause this
shows incorrect numbers as i said before, read speed 16GB/s when it is closer to 28GB/s
really? same game with different pair of DDR4 modules, same result only numbers were even worse.
Yes, really. The memory is configured once at startup. Usually, rather good values are applied. They are maintained over the entire time, so the total throughput remains constant and a significant slowdown occurs due to other causes.
shows incorrect numbers as i said before, read speed 16GB/s when it is closer to 28GB/s
You like the values from a benchmark program more that doesn’t actually work properly because it only takes a small part of the memory into account? Why do you even use a benchmark and not tarot cards to determine this values?